
Unlocking Software Design Clarity with UML
In today’s complex software development landscape, clear communication and precise documentation are not just beneficial—they’re essential. Whether you’re an architect designing enterprise systems, a developer implementing features, or a stakeholder reviewing requirements, everyone needs a shared language to visualize ideas, align expectations, and reduce ambiguity.
Enter Unified Modeling Language (UML).
UML is the industry-standard visual modeling language that empowers teams to specify, design, construct, and document software systems with precision and clarity. Born from the unification of leading object-oriented methodologies in the 1990s, UML has evolved into a versatile toolkit of 14 distinct diagram types—each serving a unique purpose in capturing either the static structure or dynamic behavior of a system.
This comprehensive guide walks you through every UML diagram type, explaining:
- ✅ What it is and its core purpose
- ✅ Key concepts and essential notation
- ✅ When to use it for maximum impact
- ✅ Practical examples to accelerate understanding
Whether you’re new to UML or looking to deepen your modeling expertise, this guide serves as both a learning resource and a quick-reference handbook. By the end, you’ll have the knowledge to select the right diagram for the right task—and communicate software designs with confidence.
Let’s explore the visual language that powers modern software engineering.
Unified Modeling Language (UML) provides 13-14 different diagram types (depending on classification) that serve as visual tools for specifying, designing, and documenting software systems. These diagrams are divided into two main categories: Structure Diagrams (showing static aspects) and Behavior Diagrams (showing dynamic aspects). This guide explains the key concepts of each diagram type.
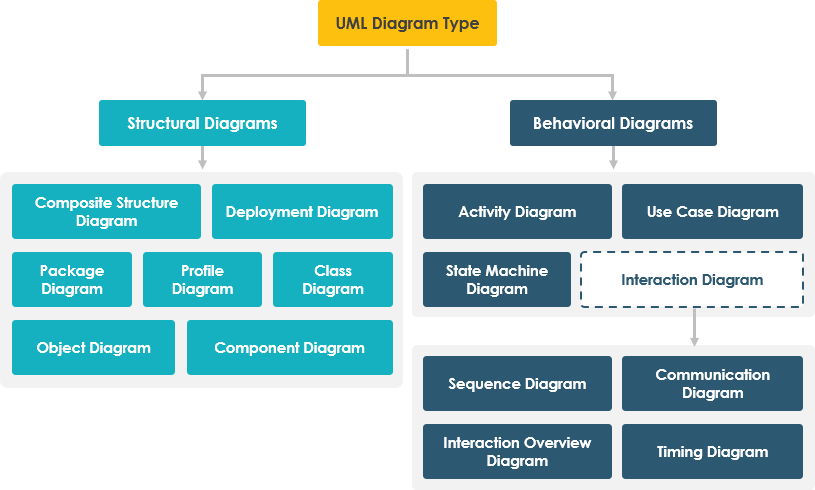
Structure Diagrams
Structure diagrams show the static structure of a system and its parts at different abstraction and implementation levels, illustrating how they relate to each other.
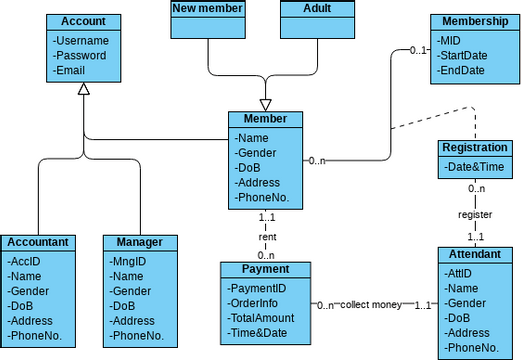
1. Class Diagram
Purpose: The foundation of object-oriented modeling, showing the system’s classes, their attributes, operations, and relationships.
Key Concepts:
- Classes: Represent types of objects in the system with attributes (data) and operations (methods)
- Relationships:
-
- Association: Relationships between instances (e.g., “Person works for Company”)
- Inheritance (Generalization): “Is-a” relationships showing class hierarchies
- Aggregation: “Has-a” relationships representing whole-part compositions
- Multiplicity: Specifies how many instances participate (e.g., 0..*, 1..1)
When to Use:
- During analysis and design phases
- To document the static structure of the system
- As a blueprint for coding
- Throughout nearly all object-oriented development
Example Elements:
- Class boxes with three compartments (name, attributes, operations)
- Lines showing relationships with arrows and multiplicity notation
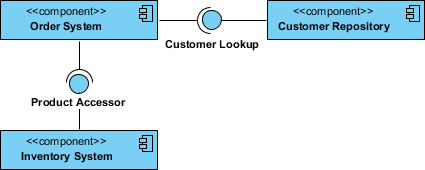
2. Component Diagram
Purpose: Shows how software components are wired together to form larger systems, illustrating architectural structure and dependencies.
Key Concepts:
- Components: Modular, replaceable parts of the system (executable, runtime, or source code components)
- Interfaces: Points of interaction between components (provided and required interfaces)
- Dependencies: Relationships showing which components rely on others
- Ports: Interaction points on components
- Connectors: Links between components showing communication paths
When to Use:
- To visualize the physical architecture of software
- During system design to plan component organization
- To document dependencies between modules
- For planning software reuse and component libraries
Example Elements:
- Component rectangles with «component» stereotype
- Interface lollipop and socket notation
- Dependency arrows (dashed lines)
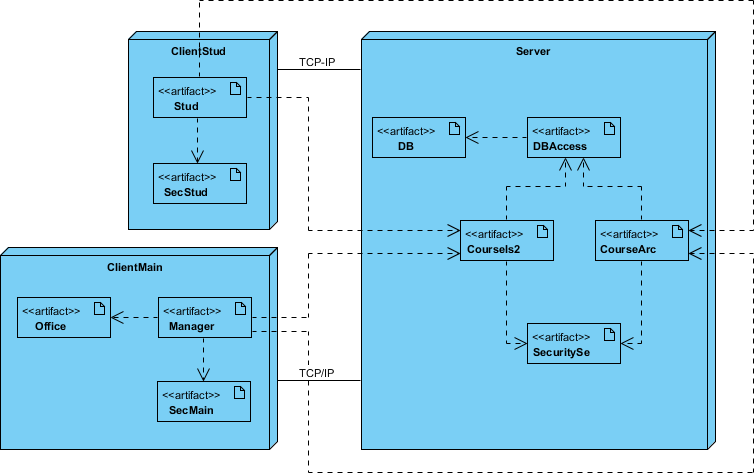
3. Deployment Diagram
Purpose: Models the physical architecture of a system, showing how software artifacts are deployed to hardware nodes.
Key Concepts:
- Nodes: Physical hardware elements (servers, workstations, devices)
- Artifacts: Concrete elements resulting from development (executables, libraries, databases)
- Communication Associations: Connections between nodes showing network communication
- Deployment Specifications: How artifacts are distributed across nodes
- Runtime Configuration: Static view of where components execute
When to Use:
- To plan hardware infrastructure
- To document system deployment architecture
- For DevOps and infrastructure planning
- To visualize distributed systems
Example Elements:
- 3D box notation for nodes
- Artifact icons within nodes
- Network connection lines
- «device» and «executionEnvironment» stereotypes
4. Object Diagram
Purpose: Shows a snapshot of instances (objects) and their relationships at a specific point in time.
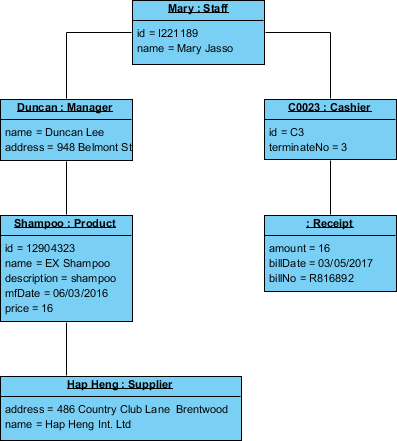
Key Concepts:
- Instances: Concrete objects (not abstract classes) with actual data values
- Instance Specifications: Named objects showing specific attribute values
- Links: Connections between object instances (instances of associations)
- Snapshot in Time: Represents the system state at one moment
- Concrete vs. Abstract: Shows real data, not class definitions
When to Use:
- To provide examples of data structures
- To validate class diagrams with concrete examples
- For debugging and testing scenarios
- To illustrate specific use case instances
Key Differences from Class Diagrams:
- Class diagrams show abstract models (classes)
- Object diagrams show concrete instances (objects with values)
- Object names are underlined
- Shows actual data values, not just types
5. Package Diagram
Purpose: Organizes and shows dependencies between packages (groups of related elements).
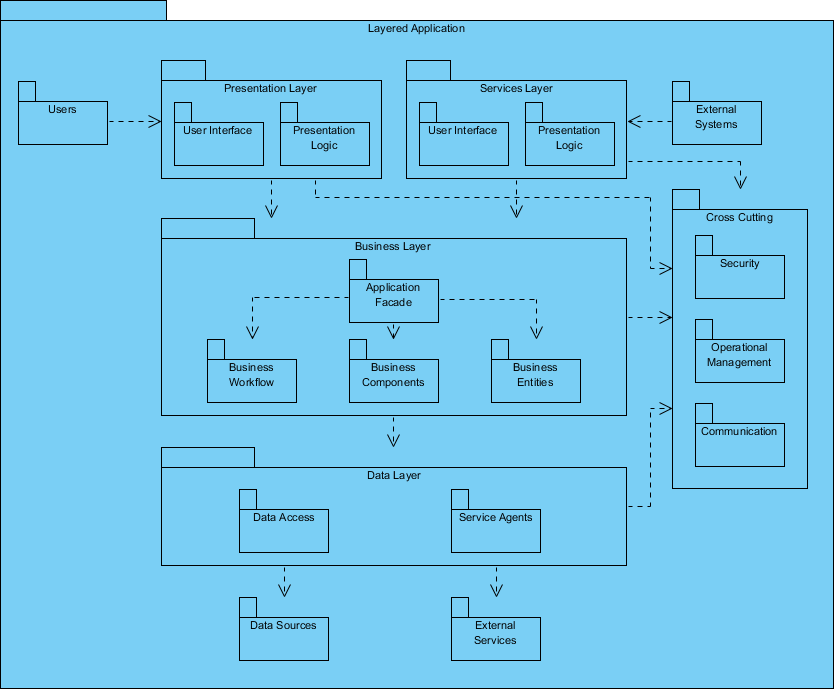
Key Concepts:
- Packages: Containers for organizing related classes, interfaces, and other elements
- Dependencies: Relationships showing which packages rely on others
- Package Merging: Combining elements from multiple packages
- Layered Architecture: Showing multi-tiered application structure
- Namespace Management: Organizing elements to avoid naming conflicts
When to Use:
- To organize large systems into manageable units
- To show architectural layers
- For managing dependencies between modules
- During enterprise architecture planning
Example Elements:
- Folder-shaped package icons
- Package names with «package» stereotype
- Dependency arrows between packages
- Nested packages showing hierarchy
6. Composite Structure Diagram
Purpose: Shows the internal structure of a class or component, including parts, ports, and connectors.
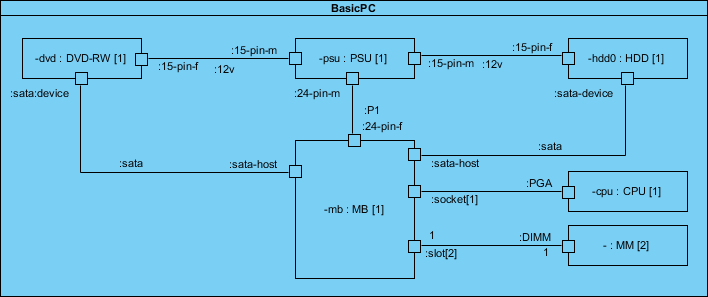
Key Concepts:
- Parts: Individual components that make up the whole
- Ports: Interaction points where parts connect to each other or the outside world
- Connectors: Links between parts or ports showing collaboration
- Roles: Defined responsibilities of each element in the collaboration
- Internal Structure: Micro-level view of how a classifier is built
When to Use:
- To model complex internal structures
- For detailed component design
- To show runtime collaborations
- When modeling patterns and frameworks
Example Elements:
- Structured classifier boxes
- Port symbols (small squares on borders)
- Part rectangles within classifiers
- Connector lines between parts
7. Profile Diagram
Purpose: Enables creation of domain-specific and platform-specific extensions to UML through stereotypes.
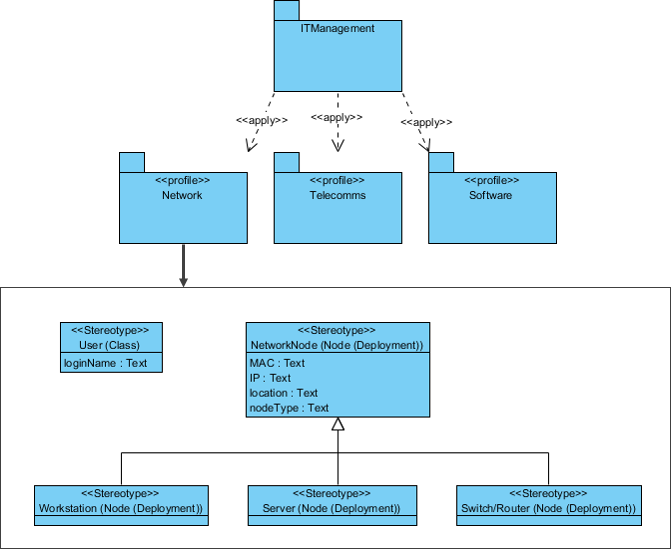
Key Concepts:
- Stereotypes: Custom extensions of UML metaclasses for specific domains
- Tagged Values: Additional properties attached to stereotypes
- Metaclasses: UML elements being extended
- Profiles: Collections of stereotypes for a specific domain
- Constraints: Rules governing stereotype usage
When to Use:
- To customize UML for specific industries (healthcare, finance, etc.)
- For platform-specific modeling (JEE, .NET)
- To create domain-specific modeling languages
- When standard UML notation is insufficient
Example Elements:
- Stereotype boxes with «stereotype» keyword
- Metaclass references
- Tag definitions
- Profile packages
BEHAVIOR DIAGRAMS
Behavior diagrams show the dynamic behavior of objects in a system, describing changes over time.
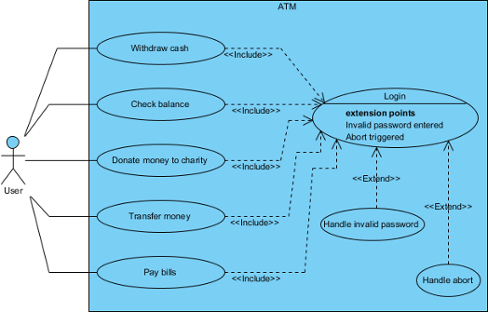
8. Use Case Diagram
Purpose: Describes a system’s functional requirements from the user’s perspective, showing interactions between actors and the system.
Key Concepts:
- Actors: External entities (users, systems) that interact with the system
- Use Cases: Units of functionality the system provides
- System Boundary: Rectangle defining the scope of the system
- Associations: Lines connecting actors to use cases
- Relationships:
- Include: Mandatory inclusion of one use case in another
- Extend: Optional extension of use case behavior
- Generalization: Inheritance between actors or use cases
When to Use:
- During requirements gathering
- To communicate system functionality to stakeholders
- For planning development iterations
- As a “menu” of system capabilities
Best Practices:
- Focus on user goals, not system features
- Keep use cases at appropriate granularity
- Use actor generalization to avoid repetition
- Document scenarios in use case descriptions
9. Activity Diagram
Purpose: Models workflows and business processes, showing the flow of control between activities.
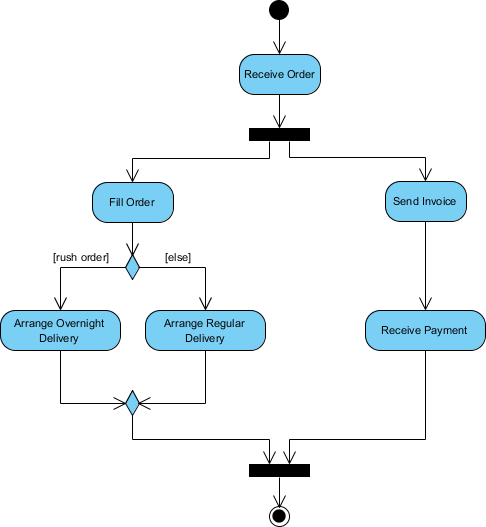
Key Concepts:
- Activities: Actions or steps in a process
- Control Flow: Arrows showing sequence of activities
- Decision Nodes: Diamond shapes for conditional branching
- Merge Nodes: Where alternative flows reconverge
- Fork/Join Nodes: For modeling concurrency (parallel activities)
- Initial/Final Nodes: Start and end points
- Swimlanes: Partitions showing responsibility (who does what)
- Object Nodes: For showing data flow
When to Use:
- To model business processes and workflows
- For describing complex algorithms
- To document use case flows
- For parallel processing visualization
Key Features:
- Supports choice (if-then-else)
- Supports iteration (loops)
- Supports concurrency (parallel activities)
- Models both computational and organizational processes
10. State Machine Diagram (State Diagram)
Purpose: Shows the lifecycle of an object, depicting states, transitions, and events that cause state changes.
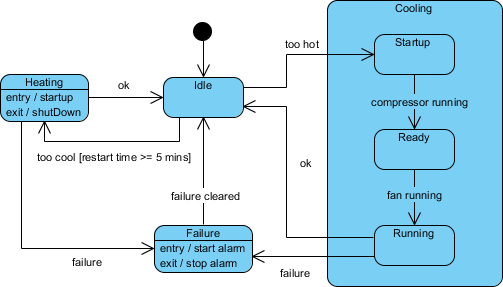
Key Concepts:
- States: Conditions during an object’s life when it satisfies conditions or performs activities
- Transitions: Arrows showing movement from one state to another
- Events: Triggers that cause transitions
- Actions: Activities performed during transitions or in states
- Initial State: Starting point (filled circle)
- Final State: End point (circle with dot inside)
- Guards: Boolean conditions that must be true for transition
- Entry/Exit Actions: Activities when entering/leaving a state
When to Use:
- To model reactive systems
- For objects with complex lifecycles
- To visualize state-based behavior
- For event-driven systems
Example Applications:
- UI component states
- Order processing workflows
- Device control systems
- Protocol implementations
11. Sequence Diagram
Purpose: Shows object interactions over time, emphasizing the time sequence of messages.
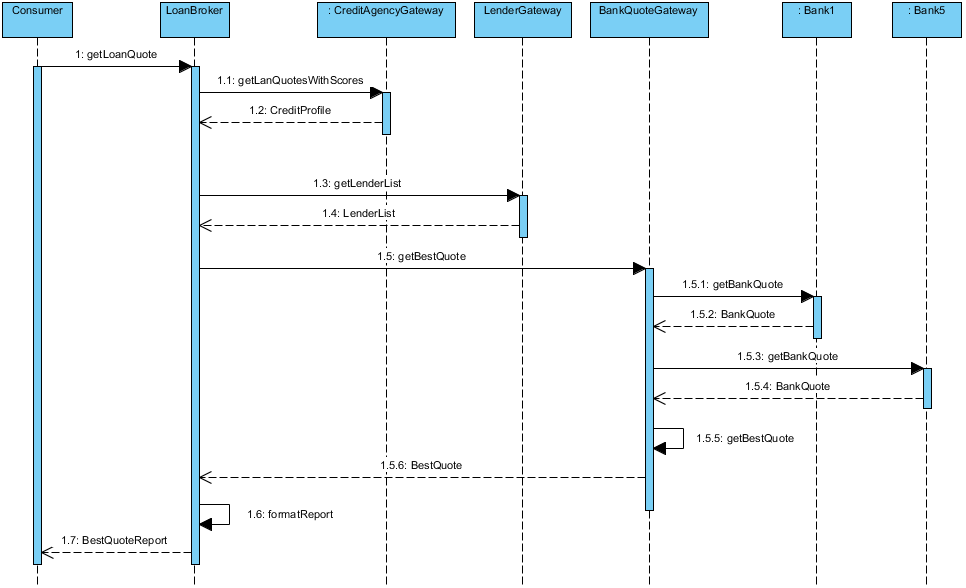
Key Concepts:
- Lifelines: Vertical dashed lines representing objects/participants over time
- Activation Bars: Rectangles on lifelines showing when an object is active
- Messages: Horizontal arrows showing communication between objects
- Synchronous: Solid arrow (caller waits for response)
- Asynchronous: Open arrow (caller continues without waiting)
- Return: Dashed arrow showing response
- Time Axis: Vertical dimension showing temporal sequence (top to bottom)
- Combined Fragments: Boxes for complex interactions (loops, alternatives, options)
- Self Messages: Messages an object sends to itself
When to Use:
- To detail use case scenarios
- For understanding object collaborations
- To document API interactions
- For debugging complex interactions
Best Practices:
- Focus on one scenario per diagram
- Show only relevant objects
- Use combined fragments for clarity
- Keep diagrams readable (avoid too many lifelines)
12. Communication Diagram (Collaboration Diagram)
Purpose: Shows object interactions focusing on structural organization and message flow rather than time sequence.
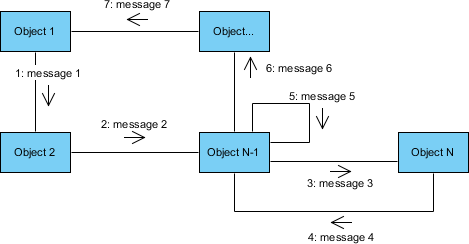
Key Concepts:
- Objects: Participants shown as rectangles
- Links: Lines connecting objects that communicate
- Messages: Numbered arrows showing sequence and direction
- Sequence Numbers: Indicate message order (1, 2, 3, or 1.1, 1.2 for nested)
- Focus on Structure: Emphasizes which objects collaborate
- Semantic Equivalence: Can be generated from sequence diagrams
When to Use:
- When object relationships are more important than timing
- To show structural organization of interactions
- For simpler interaction overviews
- As an alternative view to sequence diagrams
Differences from Sequence Diagrams:
- Shows spatial organization (not temporal)
- Easier to see object relationships
- Harder to see complex sequences
- More compact for simple interactions
13. Interaction Overview Diagram
Purpose: Provides a high-level overview of interaction flow, combining features of activity and sequence diagrams.
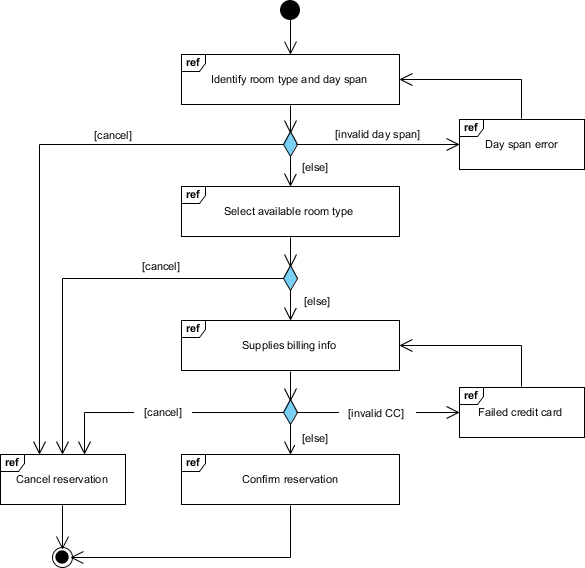
Key Concepts:
- Interaction Occurrences: References to other interaction diagrams (sequence, communication)
- Control Flow: Similar to activity diagrams, showing flow between interactions
- Decision/Merge Nodes: For conditional flows
- Fork/Join Nodes: For parallel interactions
- Hidden Details: Messages and lifelines are abstracted away
- Navigation: Links to detailed interaction diagrams
When to Use:
- For high-level interaction overviews
- To navigate between multiple interaction diagrams
- When you need both flow control and interaction details
- For complex systems with many interactions
Key Features:
- Activity diagram structure
- Interaction nodes instead of action nodes
- High-level abstraction
- Links to “real” detailed diagrams
14. Timing Diagram
Purpose: Shows object behavior and state changes over specific time periods, with precise timing constraints.
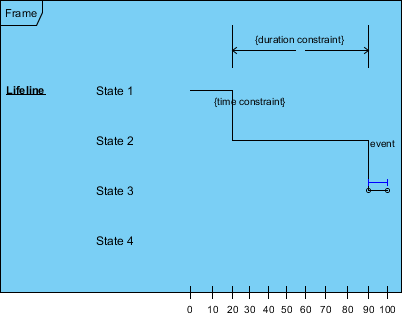
Key Concepts:
- Reversed Axes: Time increases left to right (not top to bottom)
- Lifeline Compartments: Separate vertical sections for each object/state
- State Timeline: Shows state changes over time
- Duration Constraints: Specific time requirements
- Time Observations: Specific time points of interest
- Destruction Occurrences: When objects cease to exist
When to Use:
- For real-time systems with timing constraints
- When precise timing is critical
- To show state changes over time periods
- For embedded systems and hardware-software interaction
Differences from Sequence Diagrams:
- Time axis is horizontal (left to right)
- Focus on timing constraints
- Shows state changes explicitly
- Better for time-critical analysis
Summary Table
| Diagram Type | Category | Focus | Primary Use |
|---|---|---|---|
| Class | Structure | Static types & relationships | System design blueprint |
| Component | Structure | Software components | Architecture planning |
| Deployment | Structure | Hardware & software distribution | Infrastructure design |
| Object | Structure | Instance snapshots | Example validation |
| Package | Structure | Organization & dependencies | Large system organization |
| Composite Structure | Structure | Internal structure | Detailed component design |
| Profile | Structure | UML extensions | Domain-specific modeling |
| Use Case | Behavior | User-system interactions | Requirements gathering |
| Activity | Behavior | Workflow & processes | Business process modeling |
| State Machine | Behavior | Object lifecycle | Reactive system design |
| Sequence | Behavior | Time-ordered interactions | Detailed scenario modeling |
| Communication | Behavior | Structural interactions | Object collaboration |
| Interaction Overview | Behavior | High-level interaction flow | Navigation between diagrams |
| Timing | Behavior | Time constraints | Real-time system design |
Best Practices for UML Modeling
- Choose the Right Diagram: Not every project needs all 13-14 diagrams. Select based on your needs.
- Maintain Consistency: Ensure diagrams don’t contradict each other.
- Keep It Simple: Avoid overcomplicating diagrams; create multiple focused diagrams rather than one complex one.
- Iterate and Refine: Start with high-level diagrams and drill down to details.
- Use Tools: Leverage UML modeling tools (like Visual Paradigm) for consistency and diagram generation.
- Document Decisions: Use notes and constraints to explain design choices.
- Validate with Stakeholders: Review diagrams with different stakeholders (developers, architects, business users).
- Keep Models Current: Update diagrams as the system evolves to maintain their value.
This comprehensive guide covers the key concepts of all UML diagram types. Remember that UML is a tool for communication—use the diagrams that best serve your project’s needs and your team’s understanding.

Conclusion
Mastering UML: From Diagrams to Delivery
Unified Modeling Language is more than a collection of diagrams—it’s a shared vocabulary that bridges the gap between abstract ideas and concrete implementation. By mastering UML’s 14 diagram types, you gain the ability to:
🔹 Visualize complexity – Break down intricate systems into understandable, scannable models
🔹 Communicate effectively – Align developers, architects, testers, and business stakeholders on a single visual canvas
🔹 Design with intention – Explore architectural options, validate decisions, and document rationale before writing code
🔹 Reduce risk – Identify gaps, inconsistencies, or oversights early in the development lifecycle
Key Takeaways
|
Insight
|
Impact
|
|---|---|
|
Structure diagrams capture the “what” – classes, components, deployments
|
Foundation for coding, testing, and maintenance
|
|
Behavior diagrams capture the “how” – interactions, workflows, state changes
|
Clarity on system dynamics and user experience
|
|
No single diagram tells the whole story
|
Combine diagrams purposefully for complete coverage
|
|
UML is a tool, not a mandate
|
Use only the diagrams that add value to your context
|
|
Models evolve with your system
|
Keep diagrams current to preserve their utility
|
Moving Forward
Start small: pick one diagram type relevant to your current challenge—perhaps a Class Diagram to clarify domain logic, or a Use Case Diagram to align on requirements. Practice creating it, share it with your team, and iterate based on feedback.
As your confidence grows, expand your UML toolkit. Use Sequence Diagrams to debug complex interactions, Activity Diagrams to optimize workflows, or Deployment Diagrams to plan infrastructure. Over time, you’ll develop an intuitive sense for which visual model best serves each communication need.
💡 Remember: The goal of UML isn’t perfect diagrams—it’s better understanding. A simple, clear sketch that sparks productive conversation is far more valuable than a meticulously detailed model that no one reads.
With this guide as your reference, you’re equipped to harness UML’s full potential: turning ambiguity into alignment, complexity into clarity, and ideas into impactful software.
Model with purpose. Communicate with confidence. Build with clarity. 🚀